Interest Rate Differential EUR USD: A Key Driver of EUR/USD Trends

The EUR/USD currency pair is the most actively traded in the global foreign exchange (FX) market. Here’s an overview of its market size and trading volume. In April 2022, the average daily trading volume in the global spot FX market reached $2.11 trillion. Reflecting the US dollar’s dominant role as the world’s primary vehicle currency, the EUR/USD pair was the most traded, accounting for 23% of total volume. It was followed by USD/JPY at 14% and GBP/USD at 10% (source: bis.org). Interest rates and inflation expectations are the two key factors that influence the behavior of FX rates. Naturally, higher interest rates attract capital inflow, leading to increased demand for the currency and its subsequent rise in value compared to other currencies. Inflation also plays a significant role in determining capital movements across countries. Therefore, inflation expectations are a crucial factor in shaping the flow of capital and its effect on the FX rates
This article explores two key questions:
1. To what extent do real interest rates and inflation expectations help predict movements in the EUR/USD exchange rate?
2. Which of the two—real interest rates or inflation expectations—offers greater predictive power?
Interest Rate Differential
The chart above displays the nominal 10-year government bond yields for the United States and Germany over time. Throughout the period, U.S. Treasuries consistently offered higher returns compared to German bunds. Notably, between 2019 and 2020, German bond yields dipped into negative territory, reflecting weaker economic conditions and accommodative monetary policy in the Eurozone.
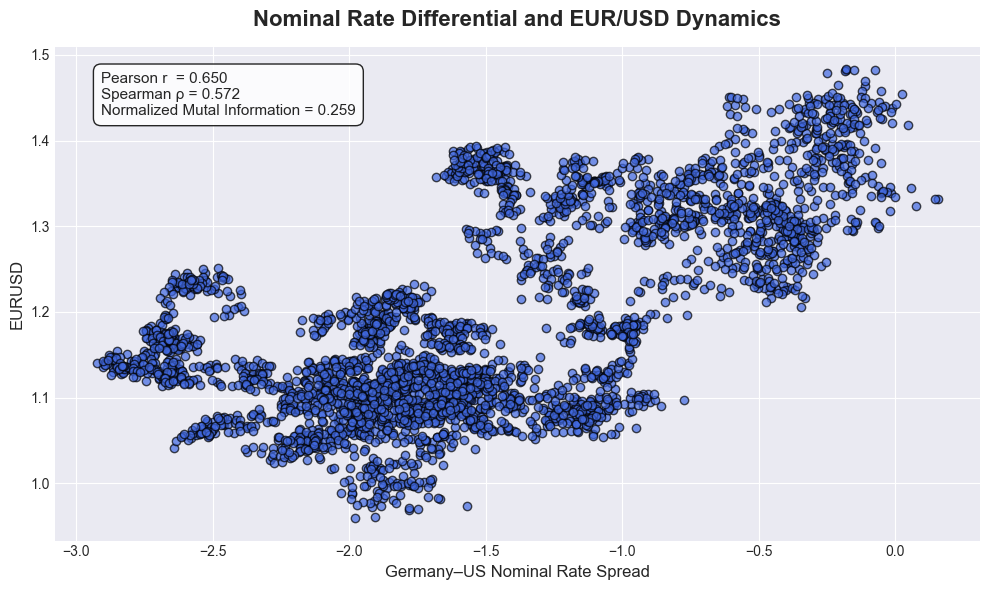
The nominal interest rate spread between Germany and the United States shows a moderate to strong positive relationship with the EUR/USD exchange rate. The Pearson correlation coefficient of 0.65 indicates a significant linear association, while the Spearman rank correlation of 0.572 confirms a moderate monotonic relationship, even when the relationship may not be strictly linear.
However, the Normalized Mutual Information (NMI) is 0.259, suggesting that while a relationship exists, it is not consistently strong across all data points. The lower NMI value implies that the relationship may be influenced by nonlinearities, regime shifts, or time-dependent dynamics that linear correlation measures do not fully capture.
This combination of metrics suggests that while the nominal rate differential is a relevant driver of EUR/USD, its predictive power is moderate and may vary depending on broader macroeconomic conditions.
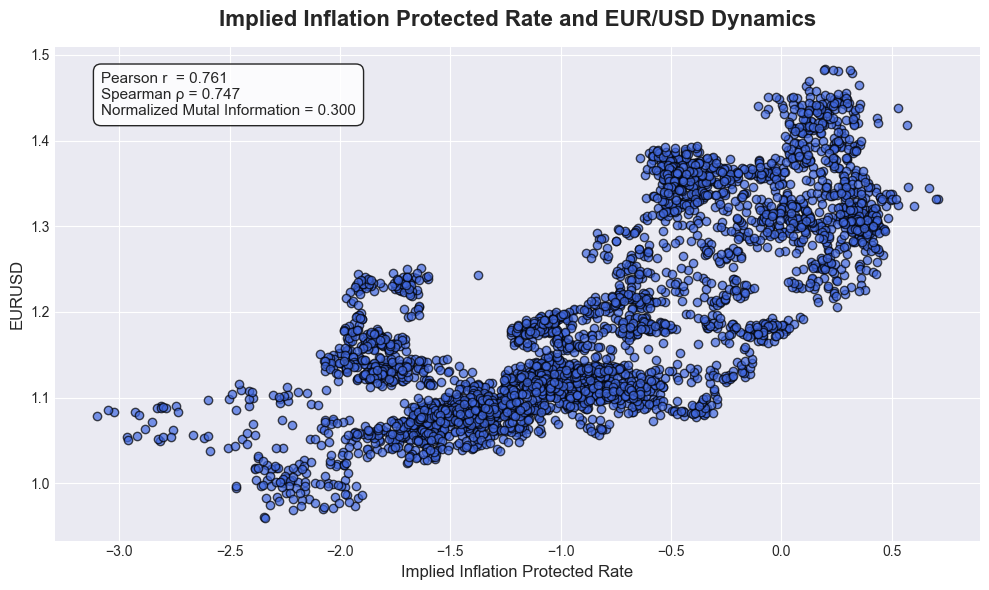
The results suggest a strong linear and monotonic relationship between the EUR/USD exchange rate and the implied inflation-protected rate, as indicated by high Pearson and Spearman correlation coefficients. However, the Normalized Mutual Information (NMI) is only 0.3, signaling that the overall dependency is moderate at best.
This discrepancy implies that while there may be localized or short-term pockets of linear relationships, the broader relationship between the variables is more complex and less consistently predictive. This is evident in the graph. In other words, traditional correlation metrics may overstate the strength of the connection, whereas mutual information provides a more nuanced view, revealing that the overall predictive power is moderate to weak.
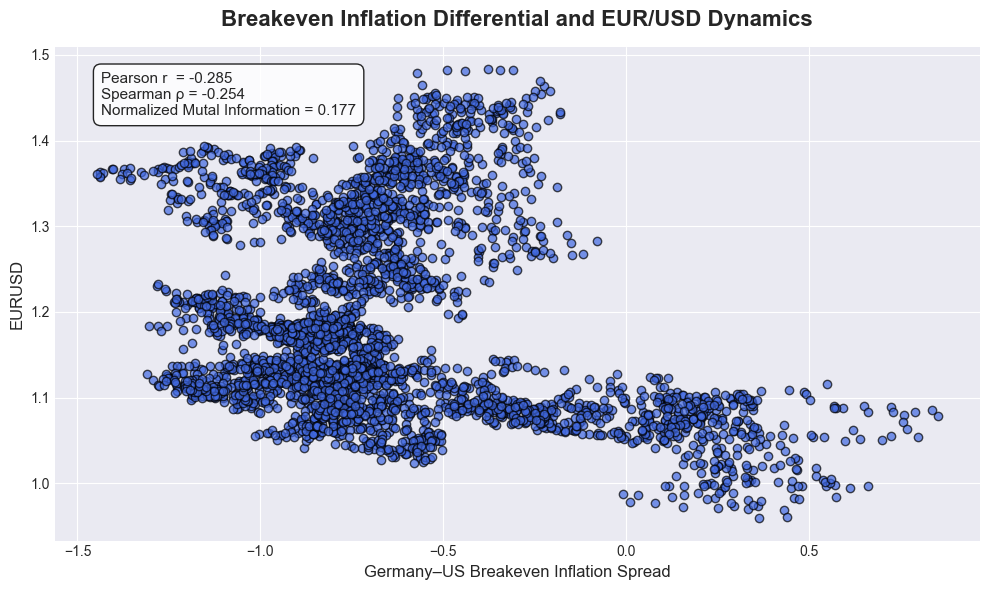
The Pearson and Spearman correlation coefficients are -0.285 and -0.254, respectively, indicating a weak negative relationship between the breakeven inflation rate and the EUR/USD exchange rate.
The Normalized Mutual Information (NMI) is 0.177, which suggests a very weak dependency, potentially driven by noise rather than a meaningful or stable relationship.
Together, these metrics indicate that while there may be some minor inverse association, the overall predictive power of breakeven inflation for EUR/USD is low and likely inconsistent.
Terminologies and Methodology
The nominal return on assets incorporates both the real rate of return and inflation expectations. To isolate and analyze the impact of each component on asset prices or exchange rates, it is necessary to estimate both the real interest rate and inflation expectations—for both the U.S. and European markets.
For the purpose of this analysis, the 10-year government bond yield will be used as a proxy for the market’s long-term interest rate and inflation expectations, acknowledging that it also reflects risk and term premia. The analysis will focus on the rates from 2010 to 2024.
US Market
In the U.S. market, Treasury Inflation-Protected Securities (TIPS) are government bonds indexed to inflation, offering returns adjusted by the Consumer Price Index (CPI). Because TIPS compensate for inflation, their yields reflect the real interest rate. While the Federal Reserve regularly publishes the 10-year nominal Treasury yield and the 10-year breakeven inflation rate, TIPS yields are inferred from market prices and available through financial data providers. By subtracting the breakeven rate from the nominal yield, TIPS rate can estimate the market-implied real interest rate.
European Market
In the European market, the European Central Bank (ECB) publishes only the 10-year nominal government bond yield. However, inflation-linked bonds are issued individually by member states. For example, Germany issues Bund-Linked Inflation Bonds, while France issues Obligations Assimilables du Trésor Indexées (OATi).
For simplicity and consistency, this analysis focuses on the German bond market, as it represents the largest economy in the European Union and provides sufficient data for both nominal and inflation-linked securities.
While Germany publishes bond prices and coupon rates, the yield to maturity (YTM) must be estimated to ensure a constant 10-year maturity. A simplified YTM formula is applied using the bond’s coupon, market price, and time to maturity.
Because bonds rarely mature on exactly 10-year intervals, linear interpolation is used between two bonds—one with a maturity just below and one just above 10 years. This produces an interpolated 10-year yield for both nominal and inflation-linked bonds.
\[ \text{Breakeven Inflation} = \text{Nominal 10Y Yield} - \text{Implied TIPS Yield} \]
The difference between these interpolated yields represents the implied breakeven inflation rate, which serves as a market-based estimate of long-term inflation expectations in Germany.
Correlation and Mutual Information
Pearson and Spearman correlation are commonly used to measure relationships between variables. Pearson correlation specifically estimates the strength of a linear relationship, while Spearman correlation measures monotonic relationships based on the ranked values of the variables.
Both methods impose structural assumptions about the form of the relationship—linearity in the case of Pearson, and monotonicity for Spearman—which may limit their usefulness when dealing with complex or nonlinear dependencies.
Mutual Information (MI), on the other hand, measures the amount of information gained about one variable by observing another. Unlike correlation-based metrics, MI does not assume any specific functional form (e.g., linearity or monotonicity), making it a more flexible and general tool for detecting any kind of dependency.
Because of this, Mutual Information is often better suited for evaluating whether one variable may be predictive of another—especially when the relationship is nonlinear or non-monotonic.
Mutual Information (MI) is a powerful metric for quantifying the amount of information one variable provides about another. Unlike Pearson or Spearman correlation, MI can capture nonlinear and non-monotonic dependencies, making it a more general measure of association.
However, raw MI values are difficult to interpret and compare, because they depend on:
- The scale and units of the variables
- The number of bins used to discretize the data
- The entropy (i.e., inherent uncertainty) of the individual variables
To address this issue, Marcos López de Prado, in his book Machine Learning for Asset Managers, suggests using Normalized Mutual Information (NMI). NMI rescales mutual information values to a range between 0 and 1, making them easier to interpret and compare across different datasets, features, or mod
def mutualInfo(x, y, norm=False):
  bXY = numBins(x.shape[0], corr=np.corrcoef(x, y)[0, 1])
  cXY = np.histogram2d(x, y, bXY)[0]
  iXY = mutual_info_score(None, None, contingency=cXY)
  if norm:
    hX = ss.entropy(np.histogram(x, bXY)[0])
    hY = ss.entropy(np.histogram(y, bXY)[0])
    iXY /= min(hX, hY)
return iXY
Normalized Mutual Information
To illustrate this, assume the underlying relationship is a linear function with added random noise:
\[ y = 2x + 5 + \varepsilon, \quad \varepsilon \sim \mathcal{N}(0,\ 2.0)\]
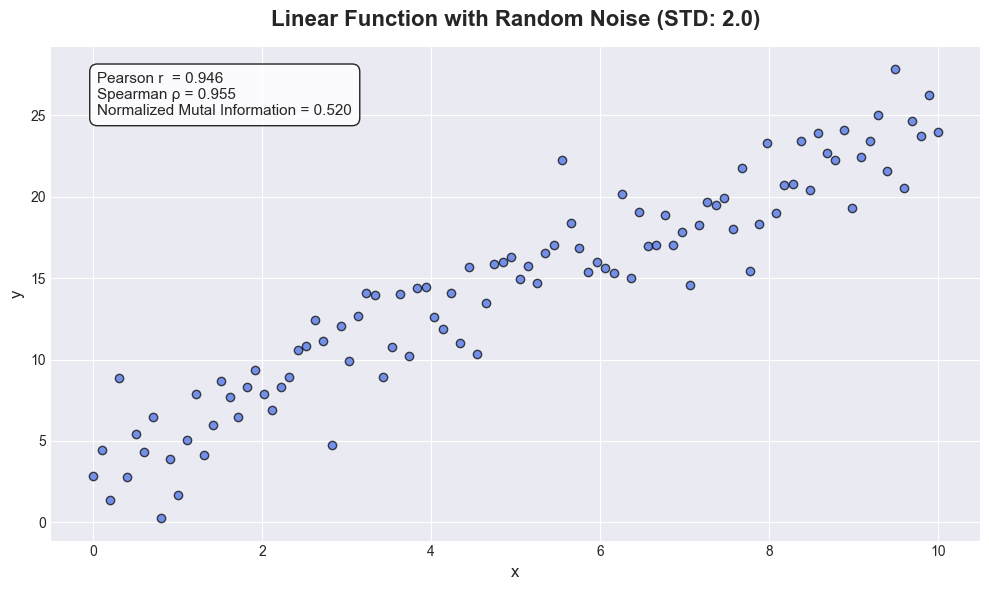
The results above show a very strong Pearson and Spearman correlation, indicating a strong linear and monotonic relationship between x and y. In addition, a Normalized Mutual Information (NMI) value of 0.52 suggests a moderate to strong dependency between the variables. Unlike correlation coefficients, NMI captures nonlinear relationships as well, providing a broader view of the shared information between x and y.
To explore how well different statistical metrics capture relationships beyond simple linear associations, the article generate synthetic data based on a nonlinear function with added random noise.
In this case, the function is defined as:
\[ y = x^2 + 5 + \varepsilon, \quad \varepsilon \sim \mathcal{N}(0,\ 2.0)\]
This is a parabolic function, where:
- x is a linearly spaced array over the interval [-5, 5]
- y is the squared value of x, shifted by an intercept of 5
- ε Gaussian noise with a standard deviation of 2.0
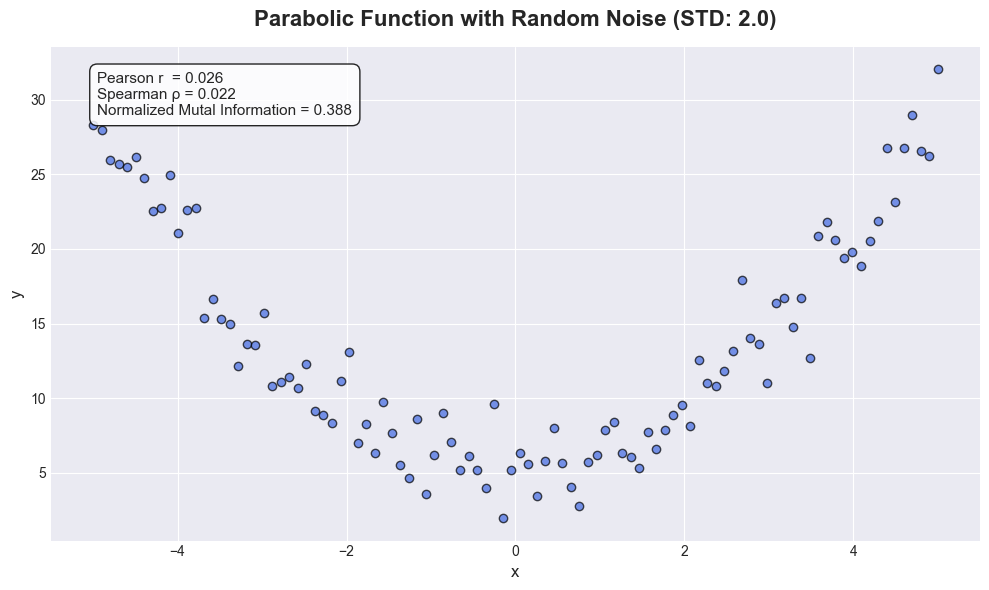
In this nonlinear example, both Pearson and Spearman correlation coefficients drop sharply to 0.025 and 0.022, respectively. This indicates that these traditional metrics fail to detect the dependency between x and y, as they are limited to capturing linear or monotonic relationships.
In contrast, Normalized Mutual Information (NMI) remains relatively high at 0.388, correctly identifying a moderate nonlinear relationship between the variables. This demonstrates the advantage of using mutual information in cases where the relationship structure is nonlinear or complex, and where correlation-based metrics may be misleading or uninformative.
Discussion and Conclusion
To what extent do real interest rates and inflation expectations help predict movements in the EUR/USD exchange rate?
The data suggests that EUR/USD is indeed influenced by the nominal interest rate spread between the European and U.S. markets. Since nominal rates reflect both real interest rates and inflation expectations, they serve as a useful aggregate measure of macroeconomic divergence.
A Normalized Mutual Information (NMI) score of 0.259 between the nominal rate spread and EUR/USD indicates a moderate level of predictive power. While not exceptionally strong, it does imply that nominal rate differentials are relevant in understanding currency valuation dynamics.
Which offers greater predictive power: real interest rates or inflation expectations?
By decomposing the nominal yield into its two components—real interest rates and inflation expectations—the analysis reveals that the real interest rate differential exhibits greater predictive strength than inflation expectations alone.
This outcome is intuitive. Over the past decade, both the U.S. and the Eurozone have maintained relatively well-anchored inflation expectations, with only temporary deviations. As a result, real rates have become the more dynamic and informative component for investors evaluating cross-border returns. Investors appear to respond more to relative real returns when allocating capital, which in turn influences currency demand and exchange rate movements.
Conclusion
While both real interest rates and inflation expectations contribute to nominal yield spreads, real interest rate differentials are the more significant driver of EUR/USD trends. The findings suggest that market participants are primarily focused on inflation-adjusted returns when making investment decisions across currencies. As a result, shifts in real yield differentials offer more meaningful insights into the future direction of the EUR/USD exchange rate.