How Fractional Differencing Changes the Look of EUR/USD Prices

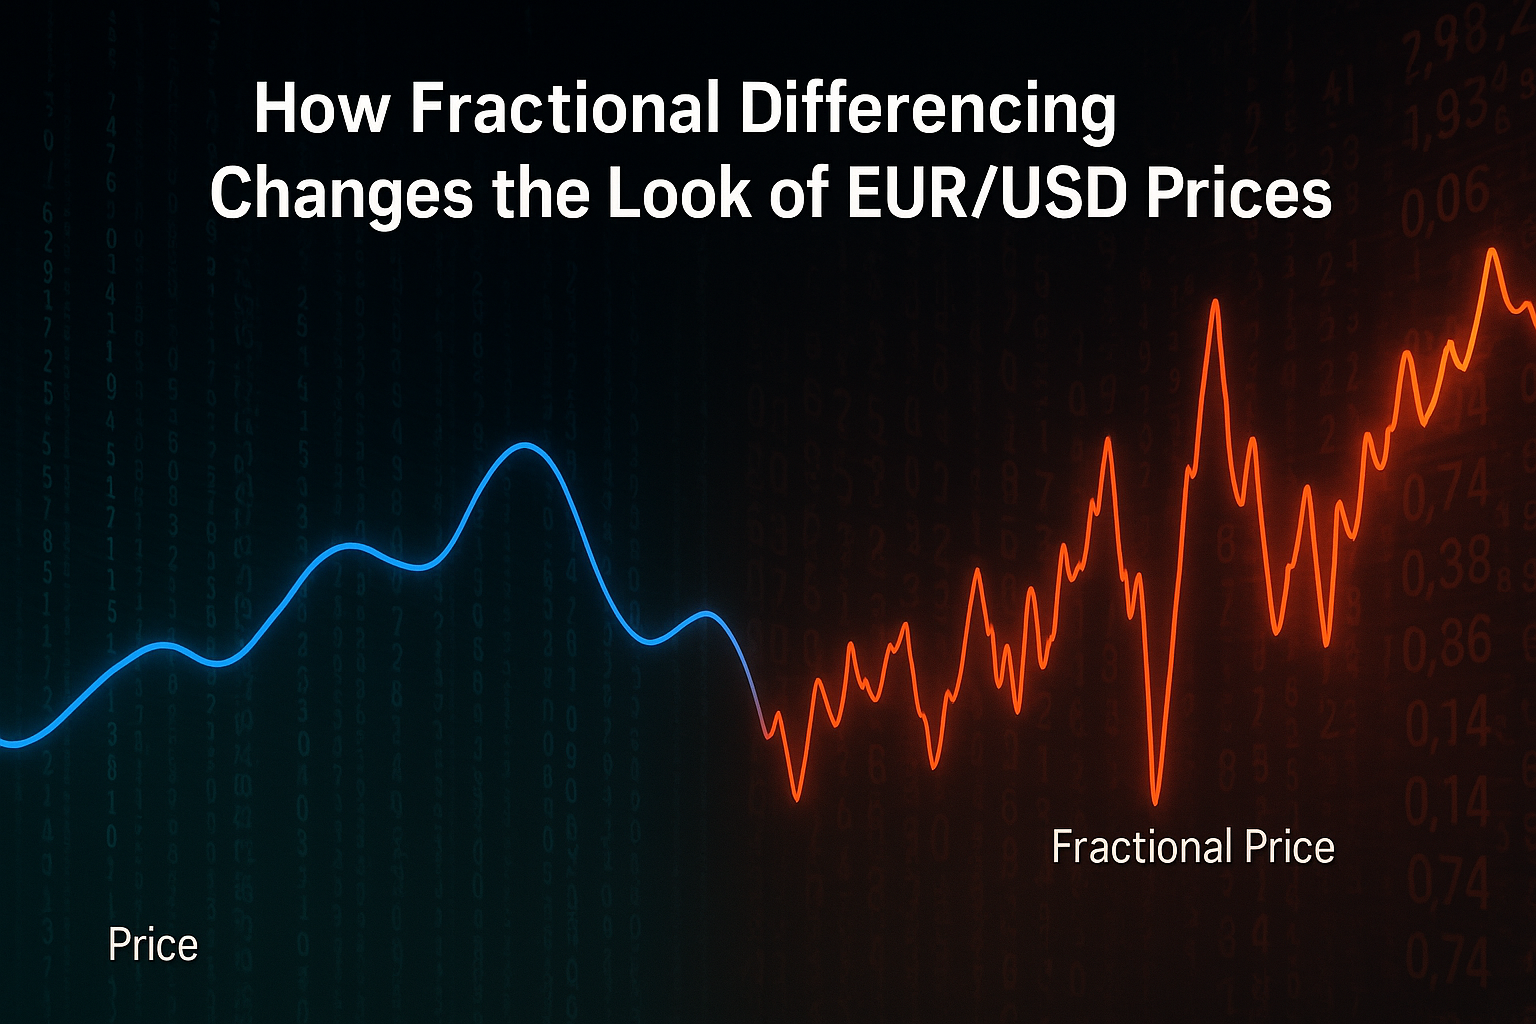
What happens when prices are transformed, yet still keep their essence? This post takes a visual dive into how fractional differencing reshapes the EUR/USD series while preserving critical information.
A fractional differencing parameter of 0.2 is applied, which is the level that makes the EUR/USD series stationary. In simple terms, a stationary series is one where the average and variability stay relatively stable over time, instead of drifting upward or downward. This stability is important because many statistical and machine learning models only work well when the data isn’t constantly shifting. The choice of 0.2 follows the reasoning outlined in From Commodities to Currencies: Making Price Data Stationary with Fractional Differencing.
The need for transformation becomes clear when considering how machine learning works. If a model is given data that always trends upward—like a running total of all past temperatures—it will struggle to find meaningful patterns. The model sees only growth, not the daily fluctuations that matter. By transforming the data into a stationary form, the model can focus on real signals, such as ups and downs, rather than being misled by constant drift.
The goal here is straightforward: place the transformed series next to the actual EUR/USD prices and compare. As Marcos López de Prado emphasizes, fractional differencing can make data stationary while still preserving valuable price level information. By viewing both series side by side, readers can visually check whether this property holds.
For those unfamiliar with differencing, the idea can be explained simply: instead of looking at raw price levels, it looks at the changes between them. It’s like tracking how much daily expenses change instead of only monitoring the total balance in a wallet. This helps remove trends (long-term upward or downward moves, like a steady climb in house prices) and drifts (slow shifts in the average level, like inflation gradually pushing costs higher).
Fractional differencing goes further by not discarding all memory of past prices. It strikes a balance—making the data easier to model while still keeping it tied to the original series.
A beginner-friendly overview of differencing can be found here: Fractional Differencing in Time Series.
Observations
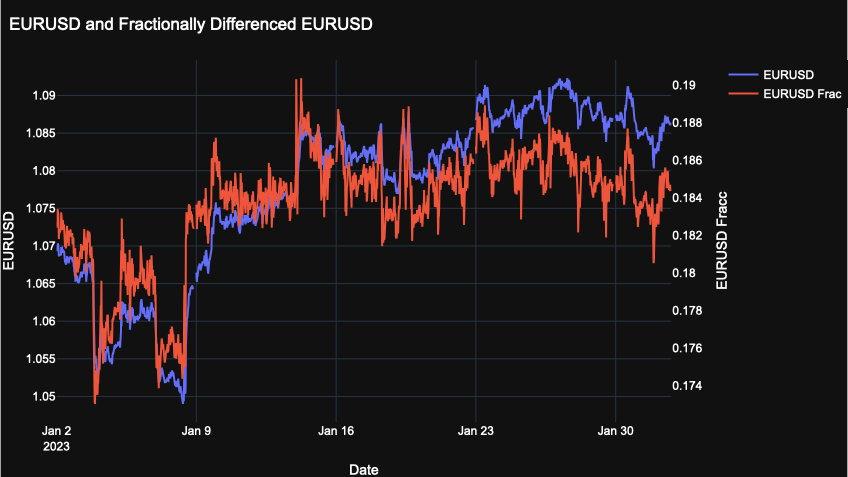
- Price vs Transformation
- The blue line (EUR/USD) shows the actual price levels — smoother, trending, and with clear upward/downward moves.
- The red line (fractionally differenced EUR/USD, d=0.2) looks noisier and oscillates within a narrower range. This is expected since differencing reduces long-term drift while keeping short-term fluctuations.
- Stationarity in Action
- The fractionally differenced series doesn’t wander upward or downward indefinitely. Instead, it hovers around a more stable average.
- This demonstrates the concept of stationarity—the transformed series has a more consistent mean and variance, which makes it easier for models to handle.
- Retention of Price Information
- Even though the fractional series is noisier, its peaks and troughs still align with the turning points of the actual EUR/USD price.
- This shows the benefit highlighted by Marcos López de Prado: fractional differencing can make data stationary while still preserving useful price-level information.
- Late January Movement
- Starting around Jan 25, both the raw price and the fractionally differenced series show a slight downward trend.
- The difference lies in expression: the raw price shows a smooth decline, while the fractional series reflects the same movement but in a choppier, more volatile pattern.
Fractional Differencing vs. Full Differencing: What Changes?
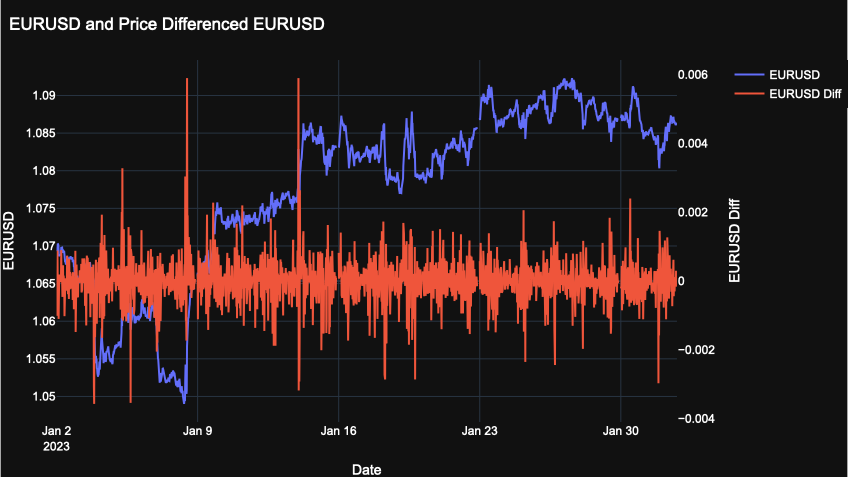
This chart shows the EUR/USD price alongside its d=1 differenced version, which is the standard way of making a price series stationary. In simple terms, each value is replaced by the change from the previous value.
The differenced series no longer reflects the fact that EUR/USD moved from the 1.06 range to around 1.08 during the period. Instead, it only shows short-term fluctuations, meaning the broader price level context is lost.
In markets like forex, this missing information is critical. Unlike equities, currencies usually trade within tighter ranges because central banks frequently intervene in FX markets for a variety of reasons. As the BIS notes, interventions may be used to reduce exchange rate misalignment, manage or accumulate reserves, or ensure market liquidity in times of stress (BIS, 2013: Central bank foreign exchange market intervention: what has changed?). These actions are motivated by the recognition that exchange rates that are too high or too low can damage competitiveness, fuel inflation, or create financial instability.
Losing sight of the price level ignores this important reality: currencies cannot be expected to drift upward indefinitely, because policy actions often push them back within ranges. This is why fractional differencing can be more useful. With a parameter like d=0.2, the series becomes more stationary while still retaining information about the underlying price level—helping models capture both stability and context for better forecasting.
Conclusion
In conclusion, fractional differencing offers a practical middle ground between keeping price levels intact and transforming the data so that it is more stationary. Full differencing (d=1), as the chart showed, strips away important context such as EUR/USD’s move from the 1.06 range to 1.08 in January 2023. That information is crucial in foreign exchange markets, where central bank interventions and macroeconomic pressures often keep currencies within tighter ranges. By contrast, fractional differencing with d=0.2 preserved this price-level information while still smoothing out long-term drift, making the series more stable for analysis.
The graphs make this trade-off clear. The raw EUR/USD series (blue) captured actual price levels but was non-stationary and difficult for models to handle. The fully differenced series (d=1) became stationary but lost context about the broader move in the market. The fractionally differenced series (d=0.2) sat in between: noisier and more stable than the raw price, yet still aligned with the turning points and directional shifts of the actual series.
This balance is what makes fractional differencing powerful. It produces data that is both statistically manageable and economically meaningful, giving models a firmer footing while preserving the information that matters for prediction.