Forecasting EUR/USD with Interest Rate Gaps: What the Germany–US Spread Tells Us

TL;DR — Can Interest Rate Gaps Help Predict EUR/USD?
This study investigates whether German–U.S. interest rate differentials and related macro features can forecast EUR/USD moves using trend scanning, a supervised labeling method from Marcos López de Prado. The dataset includes simulations across multiple forecast windows and movement thresholds, with model performance evaluated through mean decrease in accuracy, normalized by variability (mean/std).
What the Data Shows
Higher thresholds (30–40 basis points) are more predictable, likely because they correspond to meaningful market moves driven by institutional positioning or macro-level rebalancing, rather than short-term noise or intraday volatility.
Short-term forecasts (5–10 day horizon) are best supported by features calculated over 10- and 30-day trend scanning windows, particularly those tied to breakeven inflation rates in Germany and the U.S. These fast-reacting indicators capture shifts in market-implied inflation expectations, which often precede adjustments in interest rate policy or central bank tone. The fact that these signals remain predictive at short horizons suggests that markets may quickly incorporate forward-looking inflation signals into FX pricing.
In contrast, medium-term forecasts (15–30 day horizon) gain more predictive power from features also derived using 30-day windows, especially those involving the German nominal yield, real interest rate spreads, and the EUR/USD price trend itself. These variables reflect deeper structural macro forces—such as growth differentials, capital flow expectations, and monetary divergence—which take longer to manifest but exert sustained influence over currency valuation.
This distinction reinforces the importance of aligning feature construction (via trend window selection) with the intended prediction horizon, as different economic mechanisms operate over different timescales.
Heat Map: Predictive Strength by Forecast Window & Threshold
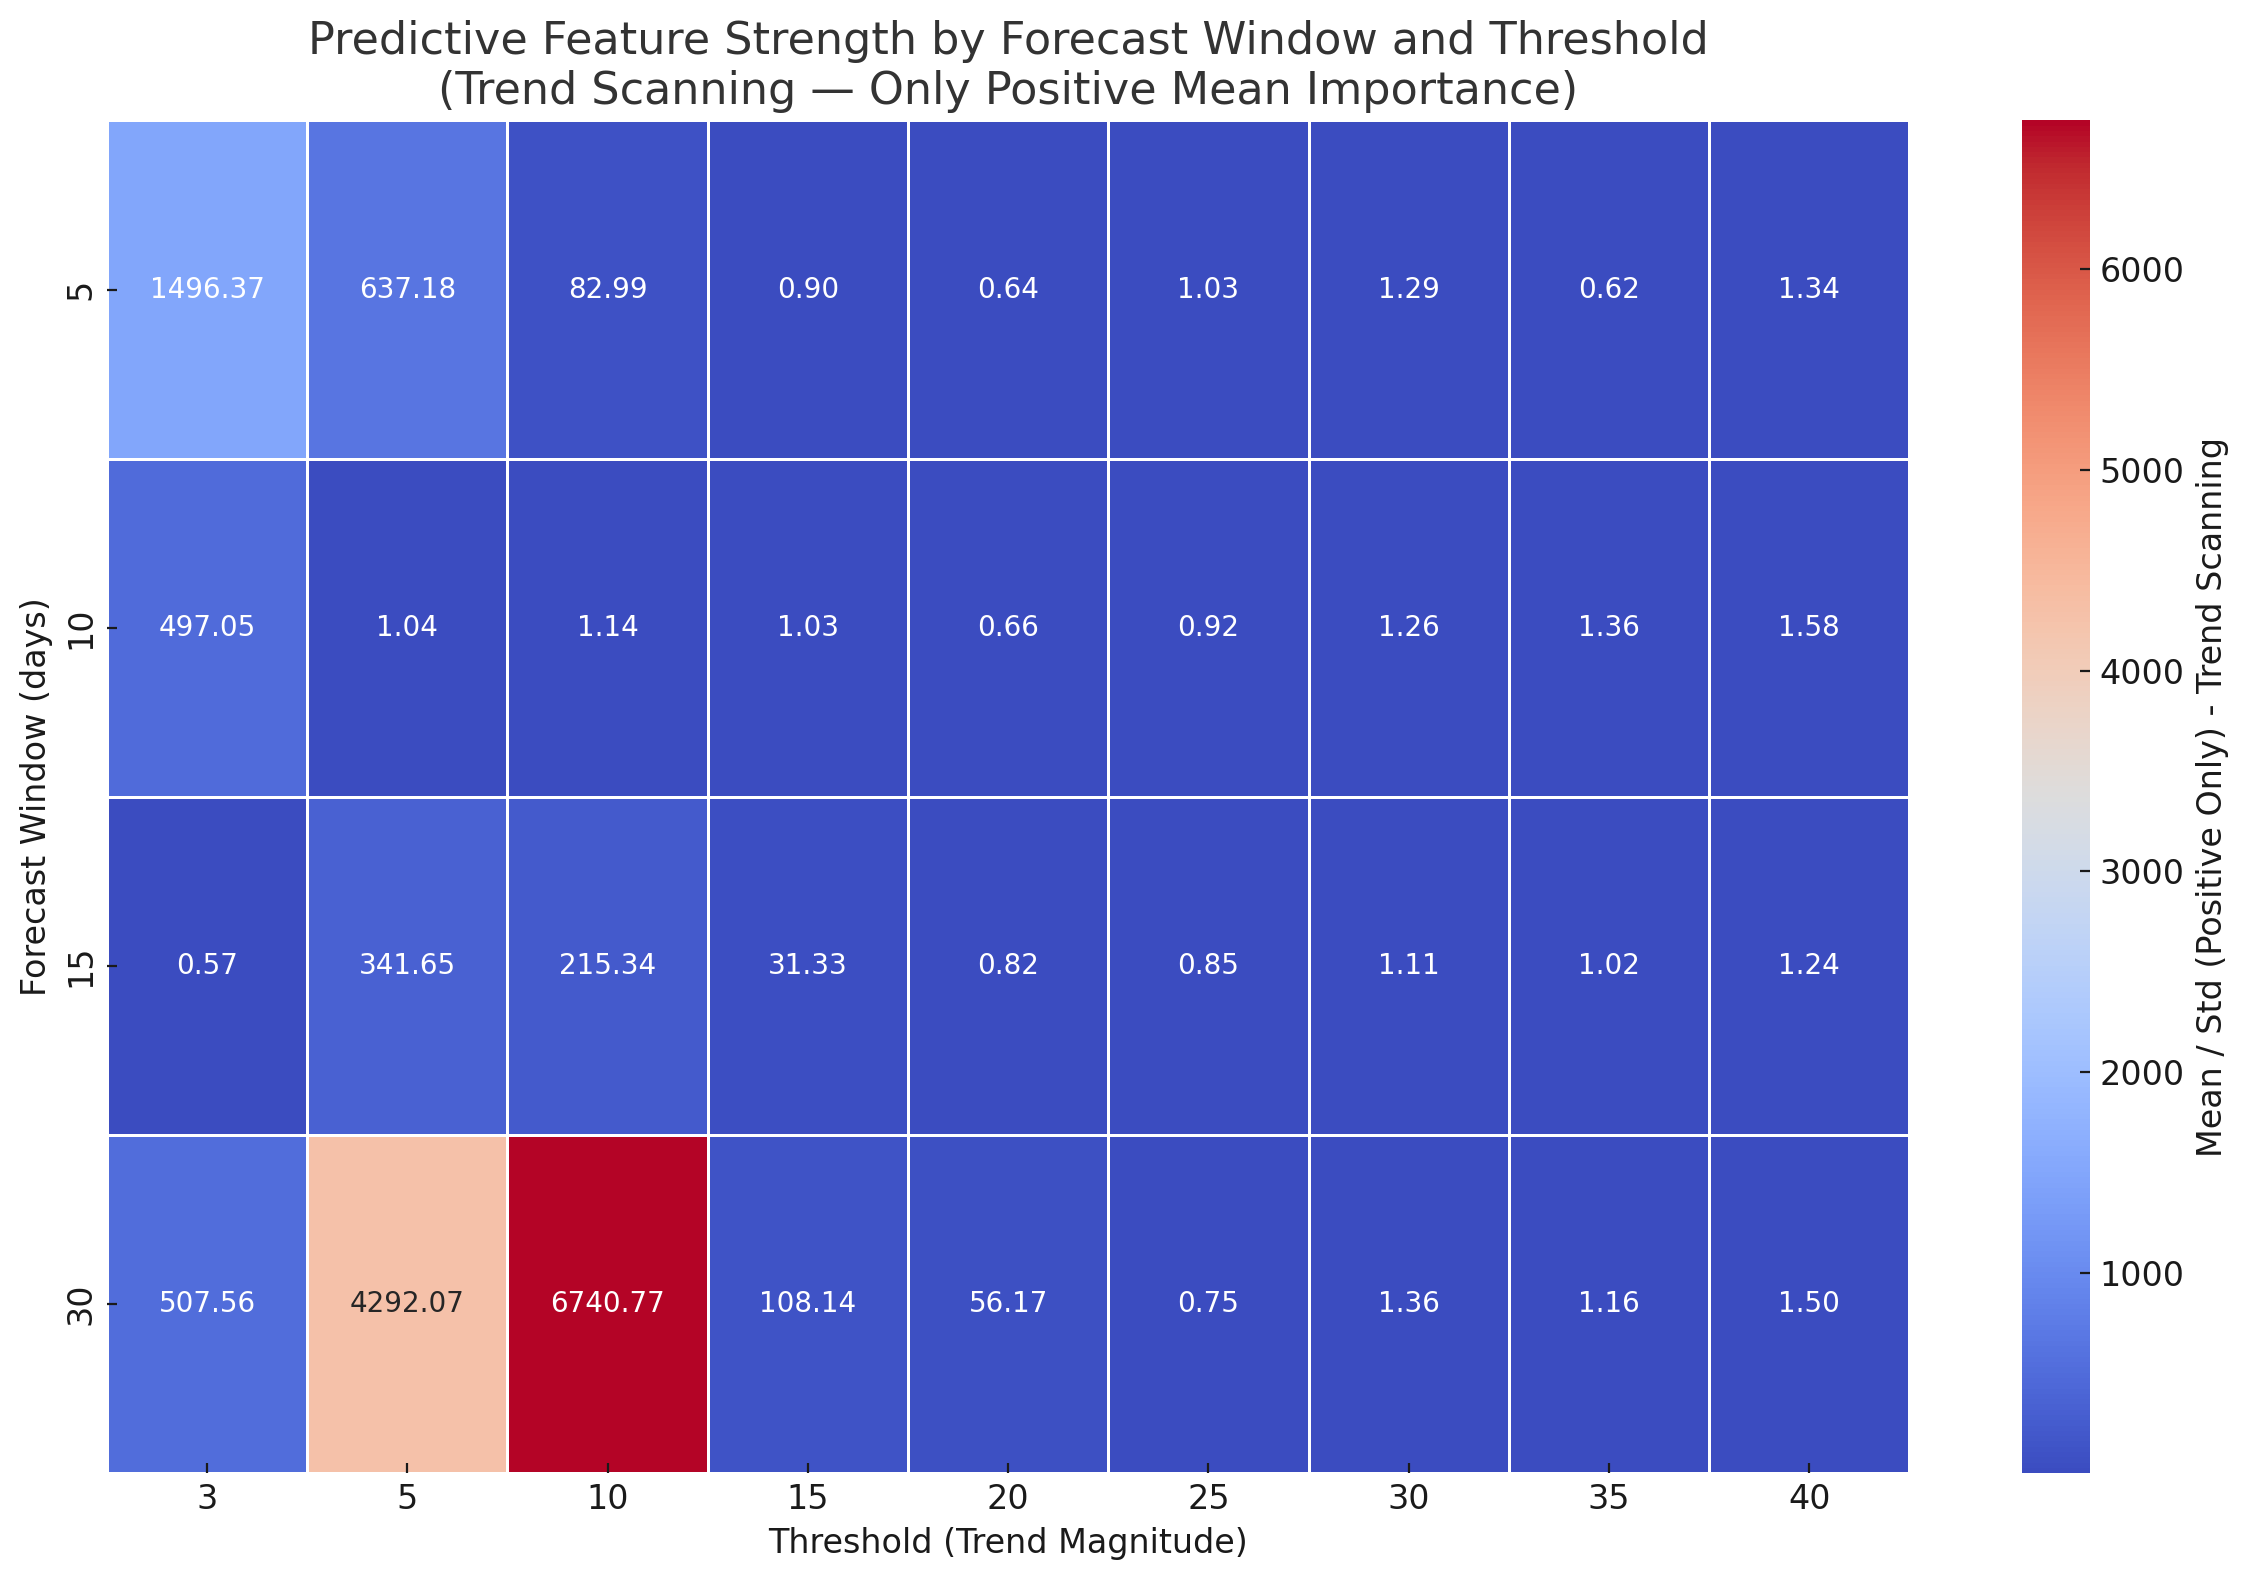
(Trend Scanning + Positive Mean Importance Only)
- Y-axis: Forecast window (days)
- X-axis: Trend threshold (minimum size of move to be labeled)
- Color scale: Mean ÷ Std — higher values = stronger and more stable predictors.
Short-Term Strategy (5–10 Days)
The most predictive configuration for short-term forecasting was found at a 5-day forecast window with a threshold of 3, meaning the model only attempted to predict EUR/USD moves when the t-value for the 5 day window trend is more than 3.
This analysis explored a range of trend scanning windows — specifically 5, 10, 15, and 30 days — to capture the directional strength and consistency of macro-financial features using t-values and slopes. While all windows were tested, the strongest predictive signals for short-term EUR/USD forecasts came from features derived from the 10-day and 30-day trend scanning windows.
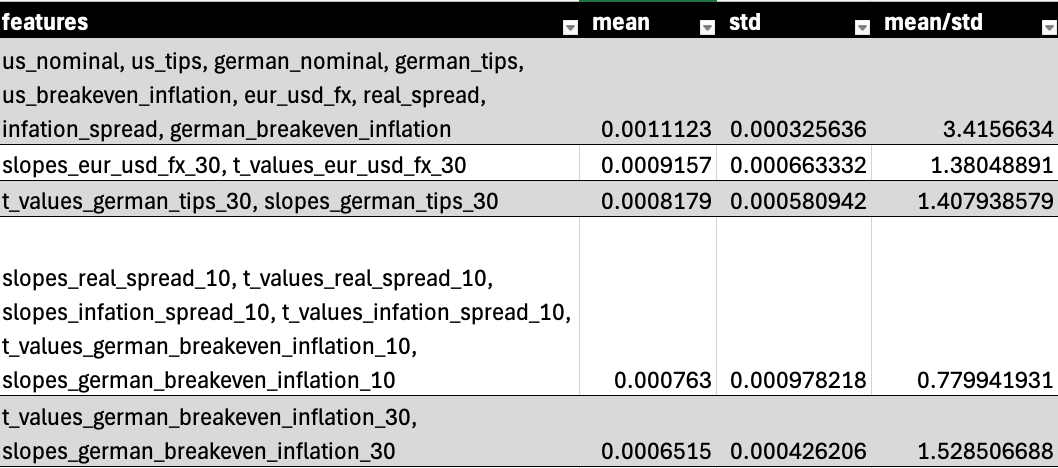
What stands out in the top-performing short-term setups is the broad macro coverage of features, yet the signal remains anchored in inflation expectations, particularly those derived from German breakeven rates. Even over a short 5-day forecast horizon, signals constructed from 10- and 30-day macro trends provide strong explanatory power.
Interestingly, EUR/USD price-based signals (like slopes_eur_usd_fx_30) do show up among the top predictors — but their signal-to-noise ratio remains lower than that of macro features. This reinforces the notion that price trend information adds value, but works best when combined with underlying macroeconomic context.
The short-term behavior of EUR/USD is not just driven by price momentum or chart patterns, but by how market participants interpret and react to evolving macro conditions — especially in the eurozone. For short-term forecasting models, these findings support a design that prioritizes forward-looking interest rate and inflation indicators, particularly from Germany, as core inputs — even when the target prediction window is just a few days ahead.
Medium-Term Strategy (5–10 Days)
The most predictive configuration for medium-term forecasting is a 30-day forecast window with a threshold of 10. In the medium-term horizon, forecasting performance shifts toward structural macro variables that capture broader market positioning and long-term economic outlooks. The most predictive features include:
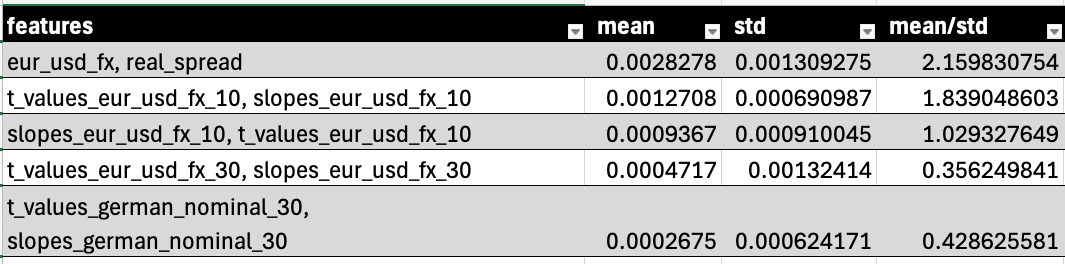
EUR/USD price trends themselves — especially in combination with the real interest rate spread — become increasingly relevant at this horizon, suggesting a reinforcing feedback loop between macro trends and market pricing.
Additionally, the presence of German nominal yields with a 30-day window hints that medium-term forecasts benefit from deeper structural signals such as rate policy outlooks and long-term capital flows.
The mean/std ratios show that while these signals may be smaller in absolute value, they tend to be stable and consistent, offering meaningful predictive insight without excessive volatility.
Definitions
To provide clarity on the methodology and variables used in this analysis, the following terms and concepts are essential:
Forecast Window
The number of days into the future the model attempts to predict the direction of EUR/USD. For example, a 5-day forecast window aims to determine whether the EUR/USD rate will move up or down over the next 5 days.
Threshold
The minimum absolute movement (in basis points) required to classify a forecasted move as a trend. If EUR/USD does not move beyond this threshold within the forecast window, no directional label is assigned.
Trend Scanning (López de Prado)
A supervised learning technique that scans historical price data to identify statistically significant upward or downward trends. It uses linear regressions over rolling windows and selects the trend with the highest absolute t-value, avoiding arbitrary labeling.
T-values
A statistical measure representing the strength and significance of a trend over a specific window. Higher absolute t-values indicate stronger, more statistically robust trends.
Slopes
The rate of change of a given feature over a window. A positive slope indicates an upward trend, and a negative slope reflects a downward trend.
Window Period Labels
Feature names include a numeric suffix (e.g., t_values_us_nominal_10, slopes_german_tips_30), where the number indicates the window size (in days) used in trend scanning to calculate the t-values and slopes.
Macroeconomic Features (All 10-Year Instruments)
All macroeconomic features in this analysis are derived from 10-year financial instruments, a commonly used duration for assessing medium-term expectations in global markets:
Nominal Interest Rates
10-year government bond yields from the U.S. and Germany. These reflect borrowing costs, market expectations of central bank policy, and economic outlook.
TIPS (Treasury Inflation-Protected Securities)
10-year inflation-protected yields. For the U.S., this is directly from TIPS. For Germany, it is inferred from breakevens and nominal yields. These represent real interest rates.
Breakeven Inflation
The difference between nominal and real yields for 10-year instruments. This represents the market’s expected inflation rate over the next decade.
Real Interest Rate
The inflation-adjusted yield, calculated by subtracting the breakeven inflation rate from the nominal yield. Real yields are key indicators of capital cost and purchasing power.
Spreads
- Real Spread: The difference in real interest rates between the U.S. and Germany.
- Inflation Spread: The difference in breakeven inflation between the U.S. and Germany.These spreads are commonly used to explain movements in currency markets, particularly in relative value models.
EUR/USD
The spot foreign exchange rate between the euro and the U.S. dollar. It reflects investor expectations about monetary policy, economic performance, and geopolitical stability in the eurozone and the U.S.
Final Thoughts
This analysis applies trend scanning, a labeling technique developed by Marcos López de Prado, to explore whether macro-financial features — particularly interest rate differentials between Germany and the U.S. — show signs of predictive power in determining EUR/USD price movements across various time horizons.
The findings indicate that macro-financial features such as breakeven inflation, real interest rates, and nominal rate spreads—all derived from 10-year instruments—are not only relevant but consistently predictive of future EUR/USD trends, particularly when combined with well-engineered statistical signals like slopes and t-values calculated over meaningful historical windows.
These variables capture market expectations and policy differentials that drive capital flows and FX revaluation. As such, they represent credible and interpretable inputs for developing predictive models in foreign exchange—whether for time series forecasting, macro-driven hedge fund strategies, or algorithmic trading systems.
Incorporating these features into a model pipeline can enhance signal quality and robustness by anchoring forecasts in fundamental macroeconomic dynamics, rather than relying solely on technical indicators or recent price behavior. This integration supports a more structurally informed approach to FX prediction, especially in regimes where macro themes dominate market pricing.