Decoding EUR/USD: The U.S. Economic Events That Matter Most


Few currency pairs react as sharply to U.S. economic news as EUR/USD — the global barometer of dollar strength and investor sentiment. Every week, forex traders around the world track high-impact events on calendars like Forex Factory, watching for red labels that warn of potential volatility: Nonfarm Payrolls, CPI, FOMC statements, and GDP releases.
But how much of this supposed “impact” is truly justified by data?
To find out, this analysis goes beyond headlines. Using historical data from FRED and time-stamped announcements from ALFRED (to eliminate look-ahead bias), it examines whether these widely watched economic events actually move EUR/USD in the short term — or whether some have been overrated for years.
👉 The findings challenge long-held trading assumptions — revealing that not all “high-impact” events are created equal.
The Core Insight
Using two complementary quantitative techniques — Trend Scanning (t-values) and Variation of Information (VI) — this analysis identifies which U.S. announcements genuinely influence how the EUR/USD behaves, not merely how much it moves after the announcement.
The results show that releases such as U.S. Exports of Goods & Services and U.S. GDP consistently produce relatively low VI values (below 0.85), meaning these events share significant information with the pair’s short-term directional structure. In information-theoretic terms, knowing the outcome of these events reduces uncertainty about how EUR/USD trends evolve in the hours and days that follow.
By contrast, inflation-related indicators — including CPI and Core PCE — tend to add little new information, suggesting that markets often price in these expectations ahead of time.
In short: Trade and GDP data reshape the rhythm of EUR/USD; inflation data mostly confirm what traders already suspect.
Data Universe
To understand which U.S. economic releases most influence EUR/USD, the analysis covered 32 key indicators across 2020–2025 — representing the broad spectrum of macroeconomic conditions tracked by traders, economists, and policymakers.
These include data on growth, inflation, trade, employment, housing, and sentiment, all drawn from official sources such as the Federal Reserve Economic Data (FRED) and announcement records from ALFRED (to avoid look-ahead bias).
| Category | Event Indicators |
|---|---|
| Growth & Output | U.S. GDP, U.S. Net Exports (GDP Component), U.S. Industrial Production Index, U.S. Manufacturing Employment, U.S. New Orders (Manufacturing), U.S. Capacity Utilization (Total Industry) |
| Trade & External Balance | U.S. Exports of Goods & Services, U.S. Imports of Goods & Services, U.S. Goods Trade Balance, U.S. Real Effective Exchange Rate Index |
| Inflation & Prices | U.S. Consumer Price Index (All Urban Consumers), U.S. Core CPI ex Food & Energy, U.S. Core PCE Price Index ex Food & Energy, U.S. Median CPI, U.S. Personal Consumption Expenditures Price Index |
| Labor Market | U.S. Nonfarm Payrolls (Total), U.S. Unemployment Rate, U.S. Average Hourly Earnings (Production Workers), U.S. Average Weekly Hours (Manufacturing), U.S. Civilian Labor Force Participation Rate, U.S. Job Openings (Total) |
| Housing & Construction | U.S. Case-Shiller Home Price Index, U.S. New One-Family Houses Sold, U.S. Housing Starts (Total) |
| Financial & Sentiment Indicators | U.S. Federal Funds Effective Rate, U.S. St. Louis Financial Stress Index, U.S. Chicago Fed National Activity Index, U.S. University of Michigan Consumer Sentiment (UoM) |
| Inventories & Sales | U.S. Total Business Inventories, U.S. Inventory-to-Sales Ratio, U.S. Retail Sales ex Auto, U.S. Consumer Credit Outstanding |
How It Was Measured
🧭 Trend Scanning (with t-values)
To quantify directional strength, EUR/USD prices were scanned across six look-forward horizons based on 15-minute bars:
- 4 hours ~ 16 bars
- 8 hours ~ 32 bars
- 12 hours ~ 48 bars
- 24 hours ~ 96 bars
- 48 hours ~ 192 bars
- 5 days ~ 480 bars
Each window generated a t-value, measuring whether returns over that interval showed a statistically significant direction.
- A high absolute t-value indicates a strong directional association between the event and subsequent price behavior.
- A low t-value suggests the movement was weak or random.
This doesn’t prove causality — it simply quantifies how strongly the post-event price path aligns with the event window.
For more details on how trend scanning works, see my article on 👉Time-Series Data Labeling.
Variation of Information (VI)
While trend scanning identifies directional strength, Variation of Information measures how much informational uncertainty in one variable (the event result) is reduced by knowing the other (the trend’s t-values).
In simpler terms:
- Low VI → the event’s actual or delta values help explain EUR/USD behavior (strong informational linkage).
- High VI → little shared information; the market moved mostly independently.
By running VI on both actual event values and their deltas, we can evaluate whether the data’s magnitude or surprise component has a stronger relationship with market structure changes.
Results: Which Events Really Matter
The tables below list the high-impact events (VI ≤ 0.85) — those showing the strongest informational linkage between U.S. data and EUR/USD short-term structure.
Based on Actual Values
| Event | Look-Forward Duration | VI Score |
|---|---|---|
| U.S. Exports of Goods & Services | 2 days | 0.795 |
| U.S. GDP | 2 days | 0.816 |
| U.S. Exports of Goods & Services | 1 day | 0.823 |
| U.S. Exports of Goods & Services | 4 hours | 0.847 |
Based on Delta Values
| Event | Look-Forward Duration | VI Score |
|---|---|---|
| U.S. Exports of Goods & Services (Δ) | 4 hours | 0.798 |
| U.S. Imports of Goods & Services (Δ) | 5 days | 0.810 |
Across all look-forward windows — from 4 hours to 5 days — U.S. trade and growth indicators consistently carried the lowest Variation of Information (VI) scores, both for actual values and delta changes (change MoM or QoQ ).
- Actuals: The lowest VI score came from U.S. Exports of Goods & Services (0.795), followed closely by U.S. GDP (0.816), both measured over a 2-day horizon. This indicates a persistent informational link between real-economy data and EUR/USD trend behavior.
- Deltas: Changes in Exports (Δ = 0.798) and Imports (Δ = 0.810) show that even the magnitude of change — not just the level — aligns closely with short-term structural market shifts.
In information-theoretic terms, these low VI values mean that knowing the outcome of these events reduces uncertainty about how EUR/USD trends evolve in the hours and days that follow.
In short:
- Inflation and sentiment data, by contrast, carry far less informational weight — confirming expectations rather than reshaping them.
- They influence not only the direction of movement but the structure of short-term market dynamics.
- Trade and GDP releases are the most informative events for EUR/USD.
Illustrating the Market Response
These Variation of Information (VI) results measure how much information overlap exists between the actual reported values of U.S. economic announcements and the t-values from Trend Scanning, which captures the directional strength of short-term EUR/USD movements.
In simpler terms, VI quantifies how much knowing the announcement value helps explain the observed trend structure of the currency.
To illustrate what this relationship looks like in time — from the moment the announcement is made — the following chart tracks EUR/USD price behavior across a 48-hour window (based on 15-minute bars).
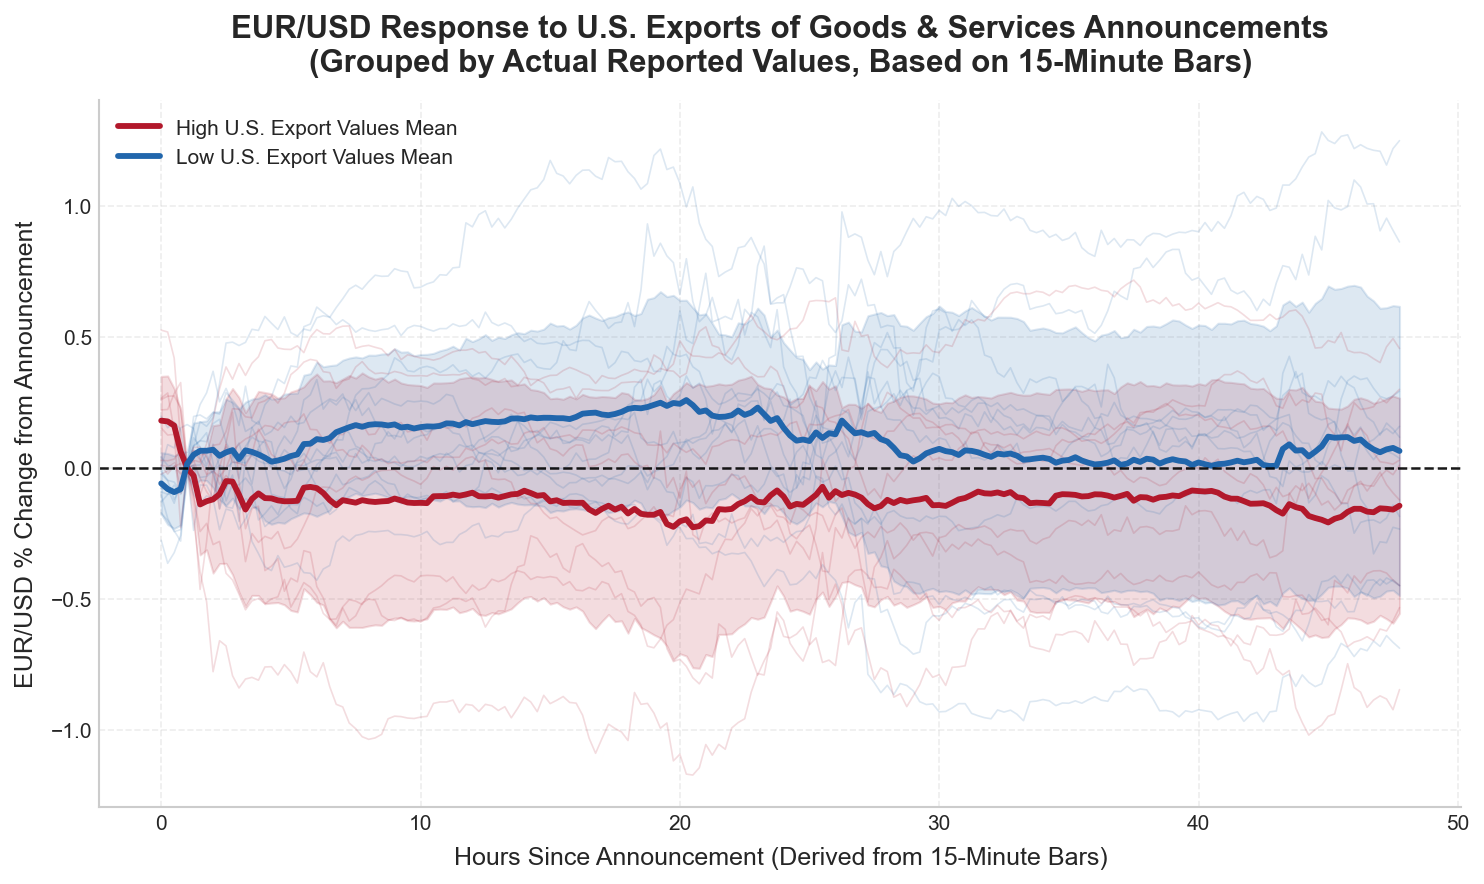
Each U.S. Exports of Goods & Services release was grouped into two categories — high and low values — based on the series median.
For every announcement, EUR/USD 15-minute closing prices were aligned around the event time, and the percentage change in price was calculated relative to the moment of release.
Each faint line represents a single event window covering up to 48 hours (192 15-Minute bars), while the bold red and blue curves show the mean response across all high-value and low-value events respectively.
This visualization uses a merge-as-of alignment between the economic calendar and EUR/USD price data to ensure precise event matching.
By plotting the average percentage change together with a one-standard-deviation band, the chart shows how market structure unfolds immediately after stronger or weaker export readings.
Higher U.S. export values (red) typically align with a stronger dollar and lower EUR/USD, while lower readings (blue) tend to coincide with mild upward drift in the pair.
In essence, this chart serves as a visual complement to the VI analysis — it doesn’t measure dependency itself, but shows how information contained in macro data manifests in observable short-term market behavior.
Conclusion
Together, the Variation of Information (VI) and Trend Scanning analyses reveal that U.S. trade and output data — particularly Exports and GDP — hold the strongest informational link to EUR/USD short-term structure.
These events consistently reduce uncertainty about how the currency behaves in the hours and days following their release, underscoring their real-time importance to market participants.
By contrast, sentiment and inflation indicators tend to reaffirm existing expectations rather than reshape them, carrying higher VI scores and weaker directional responses.
In essence, the market reacts most meaningfully not to what’s anticipated, but to hard real-economy data that redefines growth and external balance perceptions.
While the visualization provides a qualitative sense of how prices evolve post-announcement, the VI results quantify that relationship — showing that information-rich releases drive both direction and structural coherence in EUR/USD trends.
In short, the data that matters most are those that inform, not confirm.