Can COT Data Predict the EUR/USD? A Data-Driven FAQ on Positioning, Reversals, and Trading Models


The Commitments of Traders (COT) report, published every Friday by the U.S. Commodity Futures Trading Commission (CFTC), provides a breakdown of open interest in futures markets by trader type — including dealers, asset managers, leveraged money, and other reportables. For the EUR/USD currency pair, this report offers a valuable lens into institutional sentiment and market positioning.
Importantly, the report reflects trader positions as of the previous Tuesday, meaning it is always offset by several days. In practice, this means the data is only available after the trading week has already started — making it necessary to apply the data with a one-week lag to avoid introducing look-ahead bias in any analysis or model.
This article investigates whether COT data, despite this delay, can be used to forecast. EUR/USD price movements — particularly using data science tools grounded in empirical finance.
By combining weekly COT net position changes, COT Index extremes, and simple technical filters, the article aims to answer questions like:
- What does COT data show about EUR/USD over the past 10+ years?
- Does institutional positioning actually predict price direction?
- Are positioning extremes reliable signals for reversals?
Rather than relying on anecdotal trader wisdom, the findings presented here are built from backtested, quantifiable signals.
What does COT data show about EUR/USD over the past 10+ years?
The chart above displays the EUR/USD weekly closing price (in white) alongside the net position as a percentage of total open interest for three major trader categories: Asset Managers, Leveraged Money, and Dealers. This normalized format allows a consistent comparison of positioning across time and trader types.
Since approximately 2016, Asset Managers have maintained a strong net long position, often near the upper end of the scale. Interestingly, this positioning has remained stable regardless of whether EUR/USD was trending up or down, suggesting a structural long bias — potentially due to long-term portfolio allocations or hedging strategies rather than short-term speculation.
In contrast, Leveraged Money shows a more reactive and volatile pattern, frequently shifting between net long and net short. However, rather than cleanly tracking EUR/USD direction, their net positions exhibit frequent reversals, suggesting a mix of tactical positioning, speculative overextensions, and perhaps contrarian strategies — not a clear trend-following behavior.
Dealers, on the other hand, have displayed a persistently net short bias since around 2017. Given their role as intermediaries who facilitate trades and hedge client positions, this is likely not a directional bet but a reflection of their function in absorbing counterparty flow — particularly from clients like asset managers who are long EUR.
What Is Mutual Information and Does It Show Predictive Power in COT Data?
Mutual Information (MI) is a statistical concept that measures the amount of information shared between two variables — including both linear and non-linear dependencies. Unlike correlation, which only detects linear relationships, mutual information is capable of uncovering more complex, hidden structures. This makes it especially useful in financial applications, where relationships between market data are often non-linear and influenced by multiple interacting factors.
| Feature X | Feature Y | Normalized Mutual Information |
|---|---|---|
| COT Position vs EUR/USD Close | ||
| EUR/USD Close | Dealer Long Position | 0.0599 |
| EUR/USD Close | Asset Manager Net Position | 0.2032 |
| EUR/USD Close | Leveraged Money Net Position | 0.1654 |
| EUR/USD Close | Total Net Position | 0.1608 |
| COT Position vs Trend T-Value | ||
| Dealer Long Position | Trend T-Value | 0.0292 |
| Asset Manager Net Position | Trend T-Value | 0.0258 |
| Leveraged Money Net Position | Trend T-Value | 0.0307 |
| Total Net Position | Trend T-Value | 0.0291 |
| Weekly Deltas vs Close Delta / Trend T-Value | ||
| EUR/USD Delta | Dealer Net Position Delta | 0.0180 |
| EUR/USD Delta | Asset Manager Net Position Delta | 0.0220 |
| EUR/USD Delta | Leveraged Money Net Position Delta | 0.0282 |
| EUR/USD Delta | Total Net Position Delta | 0.0268 |
| Trend T-Value | Dealer Net Position Delta | 0.0192 |
| Trend T-Value | Asset Manager Net Position Delta | 0.0235 |
| Trend T-Value | Leveraged Money Net Position Delta | 0.0133 |
| Trend T-Value | Total Net Position Delta | 0.0165 |
In this study, mutual information was used to investigate whether positioning data from the Commitment of Traders (COT) report provides any predictive insight into the behavior of the EUR/USD exchange rate. The analysis relied on the normalized mutual information formulation described in Machine Learning for Asset Managers by Marcos López de Prado (2020), applying it across different pairs of market features.
Key Observations
- The analysis revealed that asset manager and leveraged money net positions exhibited the highest mutual information values with the level of EUR/USD, indicating a modest but noticeable connection.
- In contrast, mutual information between COT data and weekly changes in EUR/USD (or the t-value of its price trend) was consistently low — mostly below 0.03. These values suggest that COT data contains very limited short-term predictive power.
- In particular, weekly deltas in COT positioning did not correspond strongly with either price momentum or trend emergence.
Interpretation
These findings indicate that COT data reflects long-term positioning biases among institutional traders rather than providing signals for imminent price changes. The data appears to be more correlated with the absolute level of the EUR/USD, rather than with week-to-week volatility or directional shifts.
As such, COT positioning is better suited for framing a broader macro or sentiment context, rather than as a standalone timing tool.
How Does Extreme Positioning Lead to Reversals? What Is the COT Index?
The COT Index is a normalized measure of how extreme the current positioning of a trader group is, relative to its historical range. It is commonly defined as:
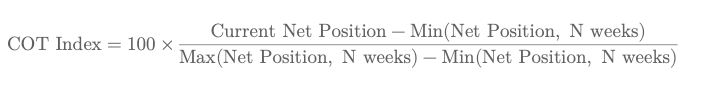
where Net Position is typically over a chosen lookback window (e.g., 13, 26, or 52 weeks). The index ranges from 0 to 1 (or 0% to 100%) and provides intuition into how “long” or “short” a group is, relative to its past.
- A COT Index near 1 (or 100%) suggests that a group is extremely long compared to its own history — a potential sign of overextension.
- A value near 0 means the group is extremely short — possibly contrarian bullish.
- A value around 0.5 is considered neutral.
| Group | Horizon | Ret. After Short Ext. (%) | Ret. After Long Ext. (%) |
|---|---|---|---|
| Dealer Net Pos. | |||
| Dealer | 13w_1w | 0.06% | -0.07% |
| Dealer | 13w_2w | 0.16% | -0.16% |
| Dealer | 13w_4w | 0.29% | -0.24% |
| Dealer | 26w_1w | -0.02% | -0.17% |
| Dealer | 26w_2w | 0.07% | -0.33% |
| Dealer | 26w_4w | 0.20% | -0.64% |
| Dealer | 52w_1w | 0.02% | -0.15% |
| Dealer | 52w_2w | 0.12% | -0.33% |
| Dealer | 52w_4w | 0.34% | -0.60% |
| Asset Mgr Net Pos. | |||
| Asset Mgr | 13w_1w | -0.06% | -0.02% |
| Asset Mgr | 13w_2w | -0.18% | -0.01% |
| Asset Mgr | 13w_4w | -0.43% | -0.12% |
| Asset Mgr | 26w_1w | -0.07% | -0.09% |
| Asset Mgr | 26w_2w | -0.17% | -0.10% |
| Asset Mgr | 26w_4w | -0.45% | -0.18% |
| Asset Mgr | 52w_1w | -0.06% | -0.03% |
| Asset Mgr | 52w_2w | -0.22% | -0.06% |
| Asset Mgr | 52w_4w | -0.56% | -0.05% |
| Lev Money Net Pos. | |||
| Lev Money | 13w_1w | -0.07% | 0.15% |
| Lev Money | 13w_2w | -0.10% | 0.21% |
| Lev Money | 13w_4w | -0.16% | 0.38% |
| Lev Money | 26w_1w | -0.20% | 0.10% |
| Lev Money | 26w_2w | -0.27% | 0.21% |
| Lev Money | 26w_4w | -0.48% | 0.40% |
| Lev Money | 52w_1w | -0.20% | 0.03% |
| Lev Money | 52w_2w | -0.32% | 0.08% |
| Lev Money | 52w_4w | -0.63% | 0.24% |
The table above is the result of testing a simple mean-reversion hypothesis:
After the COT Index for a group reaches an extreme (e.g., above 80% or below 20%), does EUR/USD tend to reverse?
To do this:
- The net position was converted into a COT Index using rolling 13, 26, and 52-week windows.
- Signals were triggered when the COT Index exceeded 80% (for potential short signals) or dropped below 20% (for potential long signals).
- The forward returns of EUR/USD were then computed 1, 2, and 4 weeks after these signals.
Insights from the Results
- While no consistent edge was found across all trader groups, the data does suggest there are some exploitable relationships—particularly in specific time horizons and groups.
- In the short term, forward returns after extreme positioning events were often negative, even when interpreted contrarianly (e.g., buying after short extremes). This suggests that extreme sentiment alone does not reliably forecast short-term reversals.
- However, for Leveraged Money, the longer-term setups (52w look back, 2–4w forward) showed mildly positive average returns after long extremes, indicating some directional signal that could potentially be exploited.
- That said, the predictive value remains weak overall, and results vary significantly across trader group and horizon. This reinforces the idea that while certain configurations might work, success depends on targeted, selective strategies rather than broad application of contrarian logic.
Forecasting Methodology Used in Mutual Information Section
This chart and accompanying method are based on the framework outlined in Machine Learning for Asset Managers by Marcos López de Prado (2020). It implements one of the core techniques in time series labeling, where the goal is to identify segments of data that exhibit statistically significant trends — a critical step before forecasting or training models. The method estimates the statistical significance of price trends using t-values derived from ordinary least squares (OLS) regression, applied over rolling windows of EUR/USD closing prices.
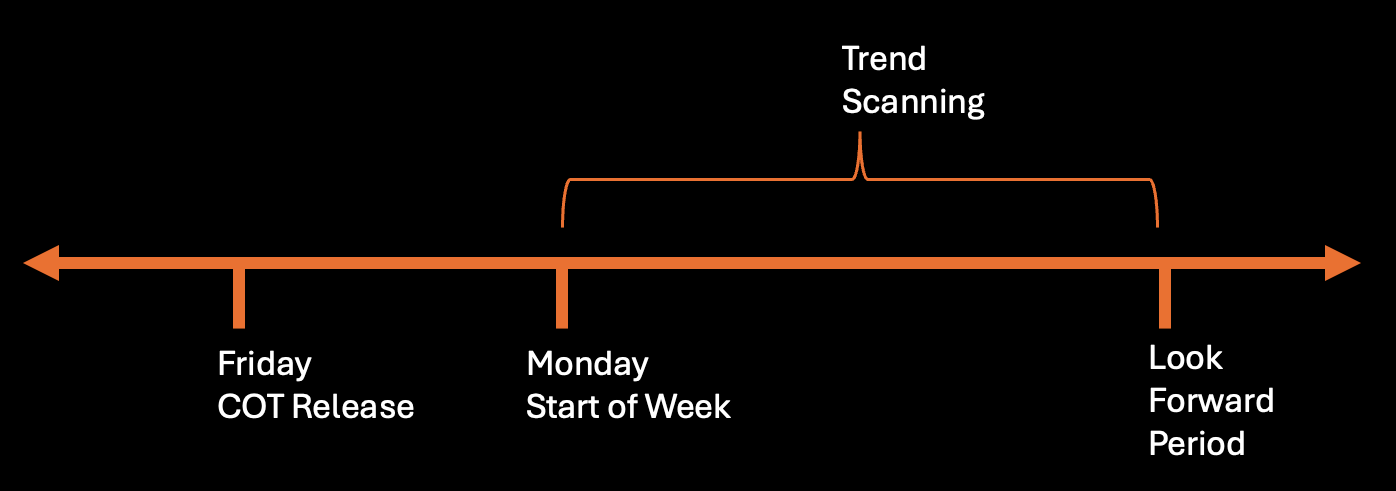
The idea behind this approach is to scan across multiple forward-looking time horizons to identify the most statistically significant trend within each window. To illustrate, the algorithm first calculates the t-value for the price trend from Monday to Tuesday, then from Monday to Wednesday, and continues extending the endpoint until it reaches the maximum look-forward period. At each step, it evaluates the t-value of the slope and ultimately selects the window that yields the most statistically confident trend.
In this analysis, a 12-week forward-looking window is applied to weekly closing prices of the EUR/USD, aligning with the frequency of the COT report, which is also released on a weekly basis. Using a shorter time frame would likely capture more market noise rather than the broader institutional sentiment trends reflected in COT positioning.
This method represents a robust time series labeling technique, useful for identifying trend regimes before applying COT signals or any forecasting model. Readers interested in learning more about this class of techniques can explore the article Time Series Data Labeling on YellowPlannet.
EUR/USD Trend Scanning Data Labelling Visualization
The chart above visualizes the weekly EUR/USD closing price, with each data point color-coded according to the t-value of the local trend identified at that time:
- Red shades indicate statistically strong uptrends (positive t-values).
- Blue shades indicate statistically strong downtrends (negative t-values).
- White or light tones suggest trend uncertainty or flatness (t-values near zero).
The darker the shade, the higher the statistical confidence in the observed trend. The confidence level can be used to properly position size the trade while the sign indicates the direction of the trade.